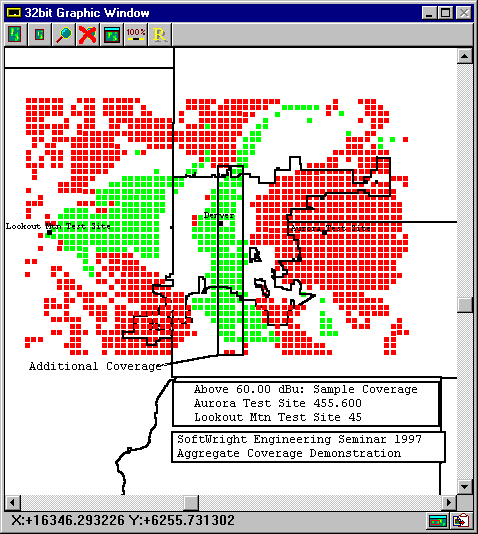
The 60 dBu coverage contours for these two sites are pictured below. Note that most of Denver county theoretically is covered by the two transmitters.

This article describes the calculations involved in a sample Aggregate Coverage calculation. For information about the operation of the Aggregate Coverage module, see the Composite/Aggregate Coverage Calculations article.
Longley-Rice Input Studies
Sites
| Lookout Mountain Test Site | Aurora Test Site |
| 39:43:46 N; 104:49:53 W | 39:43:45 N; 105:14:06 W |
| 500 W ERP | 500 W ERP |
| 455.625 MHz | 455.600 MHz |
| 7205 ft MSL | 5405 ft MSL |
| 30 ft AGL | 350 ft AGL |
| Scala RA5-450 10.0 REL; 90° Orientation | No Directional Antenna |
| Receiver Antenna Height: 3.0 ft AGL | Receiver Antenna Height: 3.0 ft AGL |
| Longley-Rice Default Parameters | Longley-Rice Default Parameters |
| 60 dBu Required Field | 60 dBu Required Field |
Coverage Area
Coverage Contours
The 60 dBu coverage contours for these two sites are pictured below. Note that most of Denver county theoretically is covered by the two transmitters.

Maximum Coverage Using the TAP Aggregate Coverage Program
The map pictured above illustrates the extent to which the two coverage areas overlap. Using the Maximum mathematical operation of the TAP Aggregate Coverage program, we have generated a study consisting of the maximum field strength value at each point in the tile region. The results of this operation are pictured below. It is apparent that the vast majority of tile points in Denver county have field strength in excess of 60 dBu.

Best Server Coverage Using the TAP Aggregate Coverage Program
Coverage Plot
Using the Best Server mathematical operation of the TAP Aggregate Coverage program, we can combine and analyze the field strength coverage from different transmitters into one file that consists of the greatest field strength at each point in the coverage region. However, each maximum value must exceed the other field values at that point by some predefined amount or "isolation". The results of this operation on our Longley-Rice input studies using an 8 dB isolation are pictured below.

Insufficient Isolation
The white or blank areas within Denver county are tile points that either did not have sufficient isolation or did not exceed 60 dBu. However, our Maximum Aggregate Coverage study pictured above indicated that the vast majority of tile points within Denver exceeded 60 dBu. Hence, the blank region within Denver county probably can be attributed to potential isolation problems.
Let’s analyze one specific point. In the plot below the circled point originated from the Lookout site and has a predicted field strength of 65.736 dBu.


Adjusting the Best Server Isolation Value
In this example, changing the isolation value has a dramatic effect on predicted coverage. As pictured below, if our receive equipment can properly distinguish signals with just 4 dB of isolation, we can increase the predicted service area in Denver county.


Simulcast Coverage Using the TAP Aggregate Coverage Program
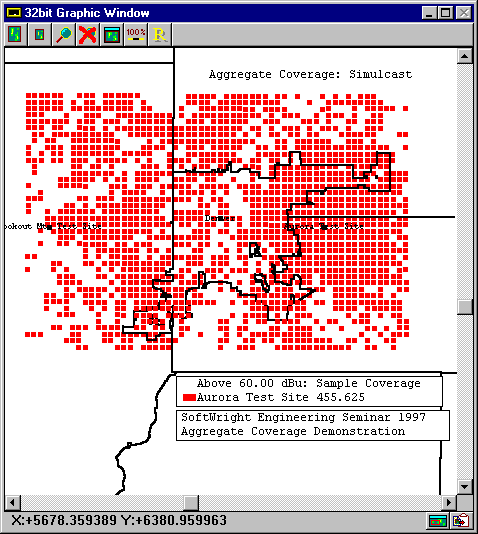
You can use the Simulcast program to calculate a field strength value at each point in the coverage region factoring in both the magnitude and relative phase of each component signal. The relative phasing of each signal is calculated as a function of wavelength and distance to a reference transmitter. After changing the Aurora Test site frequency to 455.625 MHz and applying the TAP simulcast algorithm to this example, this study predicts "holes" in Denver county coverage. Because the vast majority of independent field strength points throughout the county exceed 60 dBu, this map suggests the existence of areas where cancellation of signal may occur thereby degrading coverage.


The composite field at this point is calculated in the following manner:
|
|
|
|
|
|
|
|
|
|
|
|
|
|
|
|
l meters = 300/fMHz = 300/430.625 = 0.696661829 m
Distance to RX (Aurora):
DAl = 10304.16902985/0.697 = 14,790.7759615l
Distance to RX (Lookout):
DLl = 24904.3144859/0.697 = 35,748.0680850l
Phase Difference:
D f l = (DL - DA) = 20,957.2921235l
Non-Integer Wavelength Difference:
D f l =.2921235l
Non-Integer Wavelength Difference (degrees):
D f degrees =.916l · 360° /l = 105.16446°
Composite Signal (m V/m):
Em V/m =1183.0688 + 1936.4888 · Cos(329.760° )
= 676.5017m V/m
Composite Signal (dBu):
EdBu = 56.6054 dBu
The calculated field is less than 60 dBu. Hence, a blank appeared at this location in the Simulcast study. Because the calculated field is less than both the Lookout Mtn and the Aurora field strengths, it is apparent that cancellation occurred at that point.
|
|
Copyright 1999 by SoftWright LLC